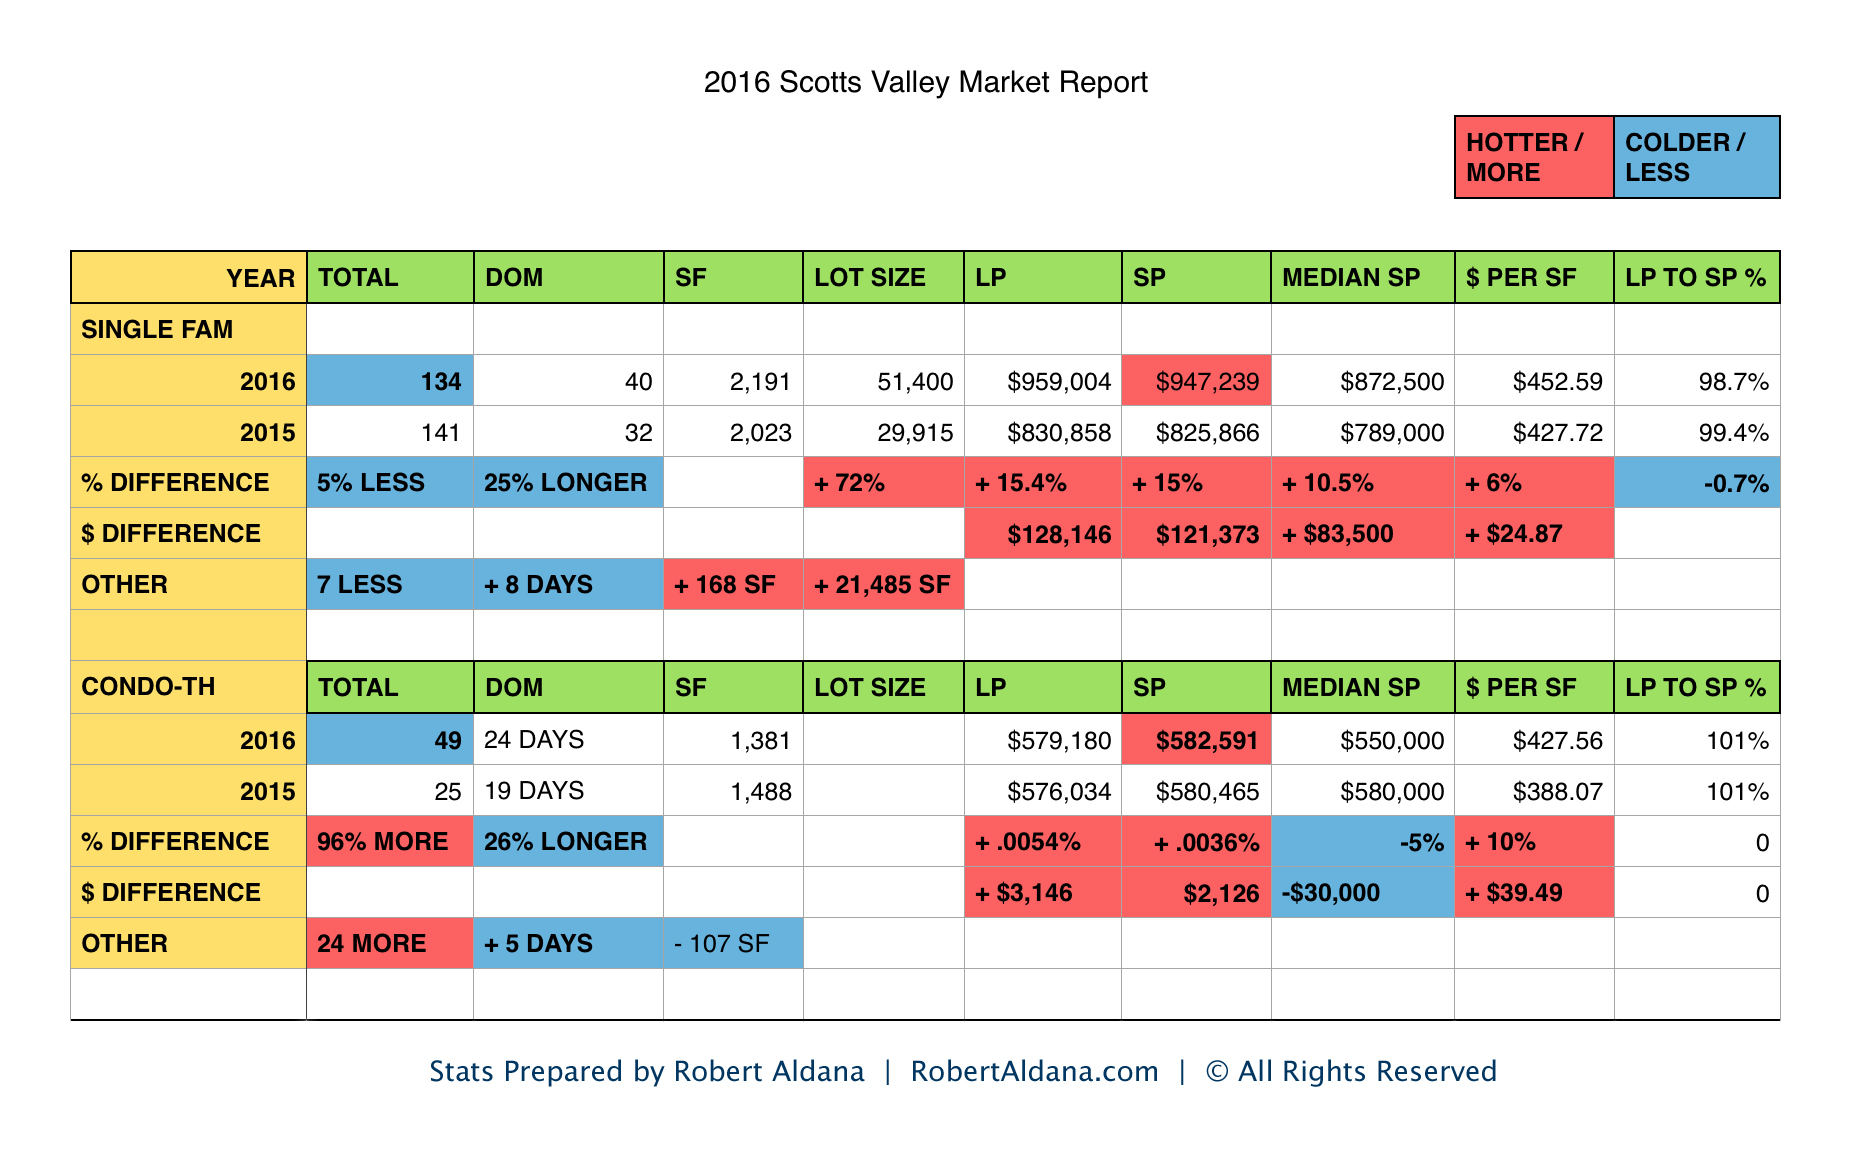
 The 2016 Scotts Valley real estate market ended up doing what many thought it would, and that was to have another banner year as the average sales price for single-family homes was up by 15% to an average of $947,239. This projects to an average of $121,373 higher then in 2015. The average price per square feet also was up 6%, to an average of $452.59 for single-family homes. Although, price per square feet is not used much in the selling and buying of resale homes, as the location along with upgrades tends to be the best determining factors of values. Meaning, very rarely do home buyers use this figure, they are more concerned with where the home is and what upgrades have been done to the home.
The same goes for Median sales price which was up by 10.5% and settled in at + $83,500 over the previous year for a figure of $872,500. *The median sales price means a price point in the middle of all data versus the average sales price.
There was also less homes that sold and closed in 2016 versus 2015, but not by much as there were only 7 less sales for a total of 134 sales. I do not think it is much of a difference or that big of a deal, but people always want to know this figure so I am reporting it. The days on market (DOM) was also higher by 25% as it took single-family homes 40 days to sell on average versus 32 days in 2015. A big deal? I don’t think so… YET. What I mean is to keep an eye on that figure as that tends to tell you what the market is doing longer term when you see a trend of DOM getting higher each year. Again, nothing to panic about, but I always watch that figure closely.
Another figure which I also tend to keep tabs on is average sales price to list price ratio and in 2016 we saw an average SP/LP ratio of 98.7%, which was .7% less than the red hot figure of 99.4% that we saw in 2015. But again, averaging a 98.7% ratio for an entire year is phenomenal. Basically, for an entire year, home sellers got almost what they asked for on the sale of their homes.
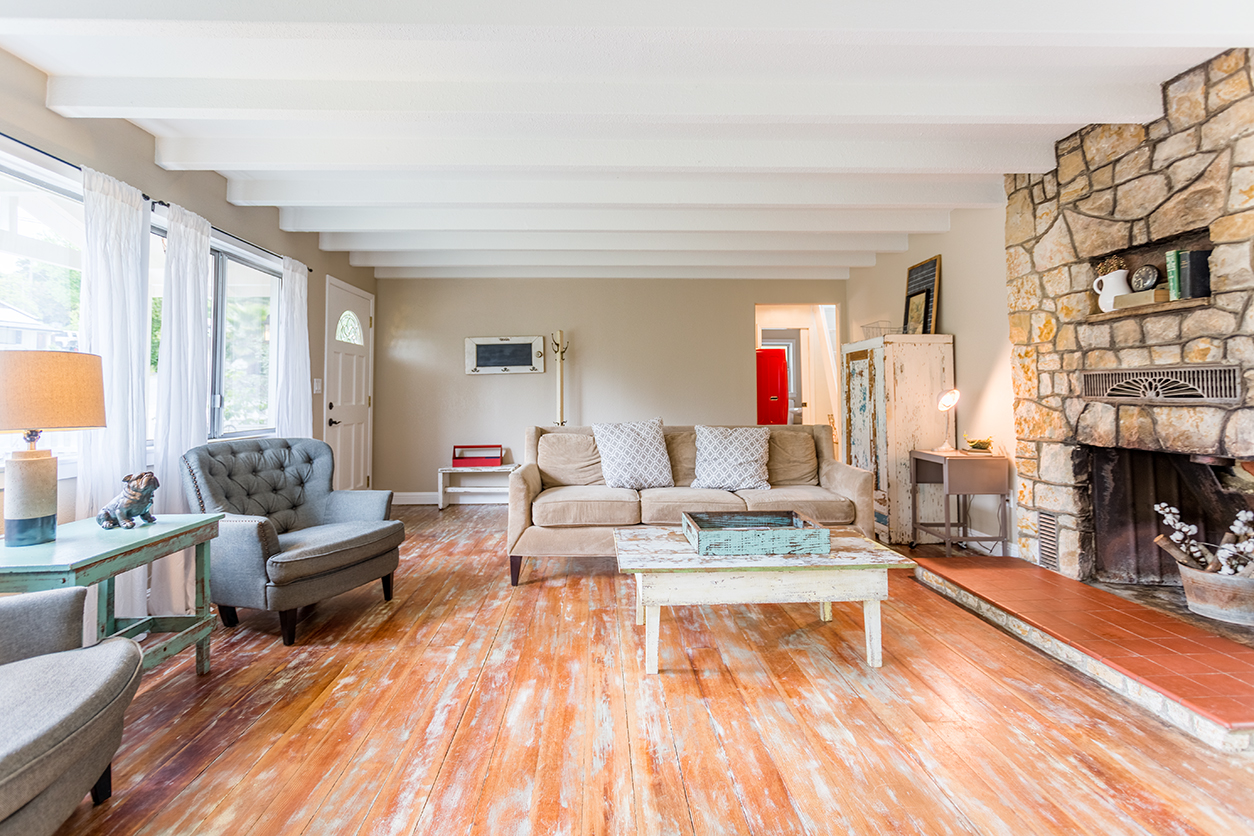
This home in Scotts Valley closed escrow for $1,120,000 in late October – $51,000 over-asking price
Condos & Townhouses
2016 was also the year of the condos and townhouses as the amount of sales almost doubled from 25 in the previous year to 49 in 2016. Although remarkably, the average sales price did not change much which was $582,591, a figure of only $2,126 higher than the previous year. So how can this be when they also averaged the same SP/LP ratio of 101%? Because those that did sell were smaller than the previous year as the average square footage for these units was 1,381 sf versus 1,488 sf in 2015. That is a difference of 107 sf smaller and in this case, price per sf does matter as condos & townhouses are usually more related and relevant to this figure because of the uniformity of these types of homes as well as similar upgrades. In 2016, the average price per sf went up by 10% to a total of $427.56 versus $388.07 the previous year.
Interestingly enough, the “median price” came down by $30,000 to a figure of $550,000.
In other words, smaller condos and townhouses were selling last year for the same price that bigger ones were the year before so although the average sales price did not change much, the value did.
The days on market also went up by 5 days to 24 days in 2016 versus the year before.
Hottest and Coldest Times of the 2016
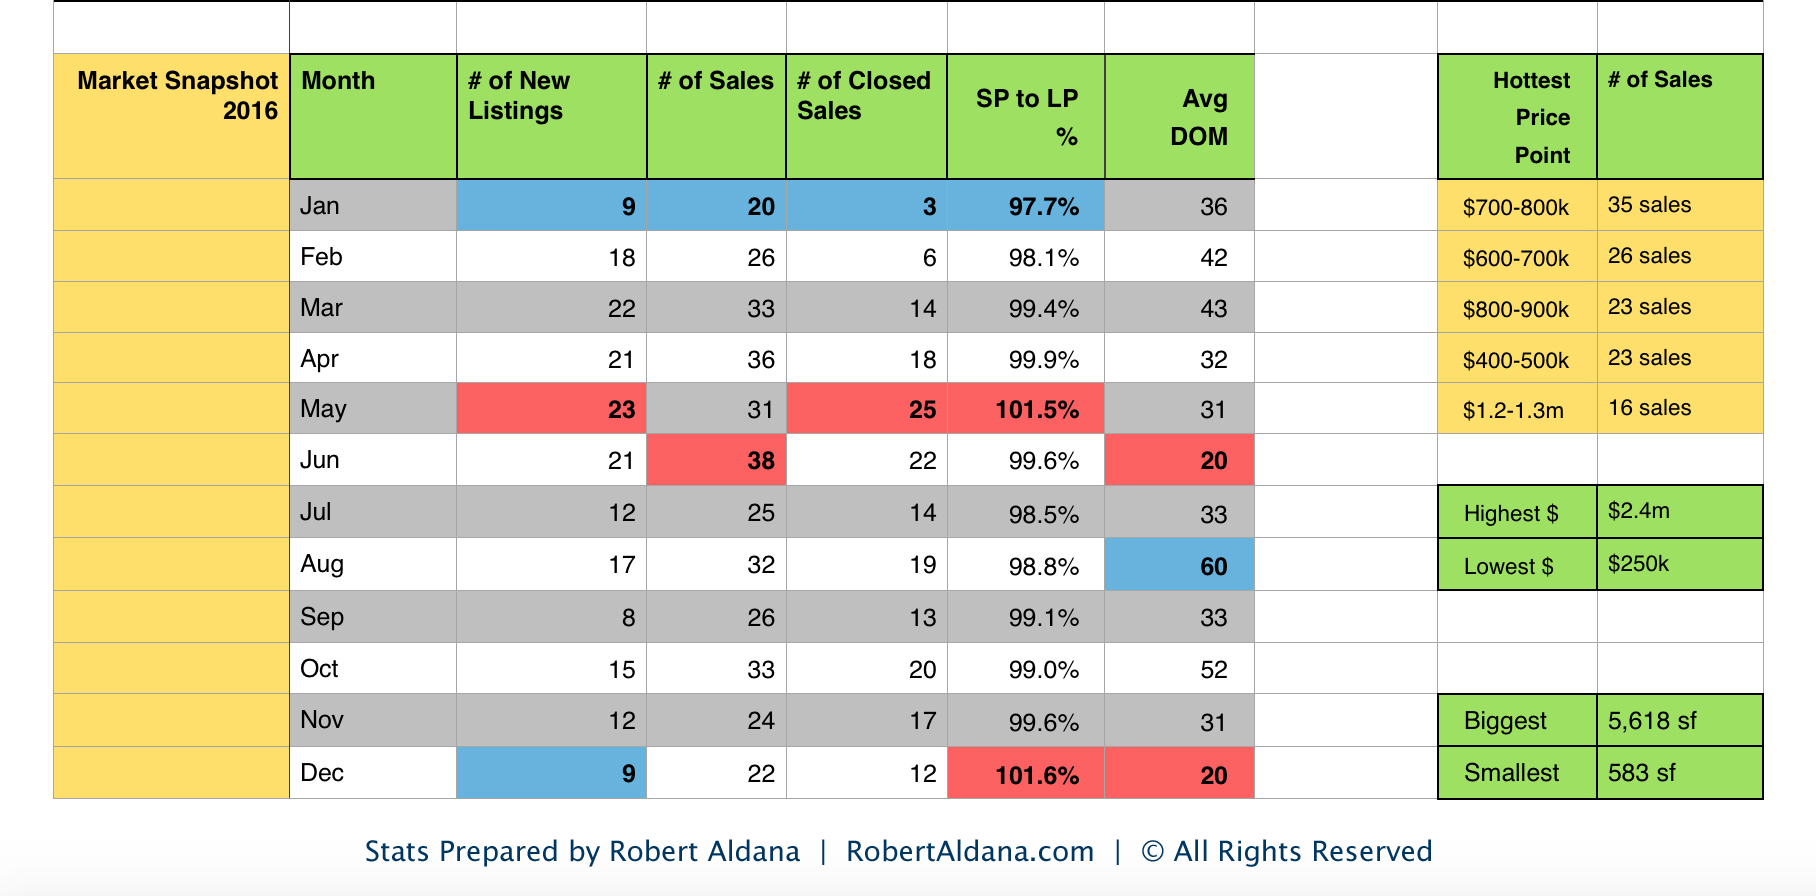 May had the most new listings with 23 and June had the most sales with 38. The most closings were in May with 25 closings, and it was also the second highest SP/LP ratio as those closings averaged 101.5% of asking price. The highest SP/LP ratio was actually in December which came in at 101.6%. History is a valuable thing… If you recall in an article I wrote in late summer of 2016, I thought that we would see a surge towards the end of the year and through the holidays and that is exactly what happened.
“I expect things to start to heat up a little right until around Halloween, and maybe just before Thanksgiving, just like it did last year.” – July 26, 2016 – click to read article
The average days on market was at its lowest in December and in June with 20 days on average, with August being the longest at 60 days on average.
The coolest time of the year was January with only 9 new listings, 20 sales and only 3 closings. The SP/LP ratio was also the lowest for the year at 97.7%.
In my personal experience, I think that I had the most calls from other agents as well as home buyers who were looking for homes starting in late January and early February, through late May and early June. Many of my home sellers and most of my activity representing home buyers and sellers also came during the first half of the year, with a few coming towards the end of the year. But definitely, the first half of the year is when things are at their hottest for a more prolonged time. The latter part of the year picked up quite a bit, but the first half had a more sustained active market in my experience, and also as the stats and figures are reporting.
Home Seller and Buyer Tips
As stated above, January was a slower time, the slowest time of the year last year. This year, however, there is very  little amount of inventory on the market and well priced and well prepared homes are moving as there are 24 total homes for sale in the 95066 zip code and only 13 of those are available. Its all about timing most of the time and if you are a home seller looking to move up or down, the cooler times are when you have a better chance as there are less buyers to compete with if you are buying a home contingent on selling your home.
Same goes for home buyers… There is not much on the market but if you do find something you like, you will not face as much competition as when the market heats up and believe me when I say this, it will heat up within the next 30-60 days as it does every year.
Interest rates have also went up by about 1% for a 30 year fixed since the elections in November. I think that we may see a settling down of rates in the near future, and although they may go up a little more, they could also come down a bit. But remember, we saw rates in the 3.25% to 3.5% range and those rates were phenomenal. Had we not seen those rates, everyone would be ecstatic to see rates a 4.25% today. It’s really all relative.
Predictions
That is a tough one. I stated last year that I thought that 2016 would be the last hurrah of crazy appreciation rates and… I think that I am going to stick to my prediction, for the most part. I see home prices doing well this year in the area and in the Bay Area, I just do not see how we could see another crazy appreciation this year in Scotts Valley, because at some point everyone gets priced out. Yet compared to home prices in Silicon Valley, homes are a bargain here in Scotts Valley. And yet while I still see more families coming from Silicon Valley, I see less of them coming this year.
And to throw another angle into the mix, we have a new President coming into office and it really is tough to gauge how that will go in the financial market. It’s not a cop-out, its just such an uncertainty that I don’t know how anyone can comfortably predict this year.
However, this is what I will always say: If you are buying a home, buy it and keep it for at least 10 years or more. I think that the days of buying and flipping within a year or two have dwindled down. While you will more than likely see a gain, I am not sure it is a gain that will be substantial after closing costs of selling it. Think long-term.
Happy Selling and Happy Buying!

 Robert Aldana
REALTOR® since 1986
BRE # 00921165
Keller Williams Realty in SV
5522 Scotts Valley Drive
Scotts Valley, CA. 95066
831-252-3959 Direct Line
[email protected]
www.RobertAldana.com/Testimonials
Robert Aldana is a 30+ year licensed real estate veteran with American Dream Realty in Scotts Valley, and also a long-term resident and homeowner here in town. He is the founder of MyScottsValley.com and the popular local news and events page at Facebook.com/MyScottsValley.
Robert was also a nationally syndicated real estate journalist and was a highly sought after interviewee on the topic of real estate by local, national and even international media, in addition to appearing on HGTV and local NBC’s “Best of the Bay”.
Many of his articles and interviews can still be read at RobertAldana.com, RealtyTimes.com, Forbes.com, among many other real estate and finance news sites and publications.